Greenville South Carolina - Current Market Report

or Create your own market report

Greenville, South Carolina

Centrally located between larger metropolitan areas such as Atlanta, GA and Charlotte, NC, Greenville, South Carolina has become one of the fastest growing urban areas in South Carolina. In the last 20 years, Greenville has made many improvements to attract new business to the area including a revitalized Downtown district. Greenville features a variety of things to do year round including the popular Downtown Farmers Market from May to October; Fall for Greenville, Artisphere; Euphoria; and more! Residents love Falls Park, which features a large park with waterfalls, trails and gardens, and a famous suspension bridge overlooking the Reedy River.


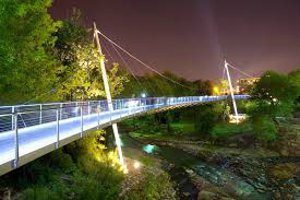
Greenville is well known for the more than 600 restaurants that feature everything from farm-to-table cuisine promoting local meat and produce to International Cuisine. Additionally, residents to the area can enjoy Broadway productions at The Peace Center and popular sporting events and concerts which are regularly scheduled at the Bon Secours Wellness Arena. 

Real Estate in Greenville, South Carolina

With its I-85 corridor location, Greenville is well positioned for growth and is a perfect community for any type of home you're looking for! Those looking to move to the area can choose from a newer subdivisions, older established homes on properties with mature trees, homes with acreage, and modern downtown condos. For those looking to build, there is a selection of vacant land available. Golfers will love the scenic home sites backing onto the several golf courses and country clubs in the area including Thorneblade Country Club and Greenville Country Club, and more!

Homes in Greenville, SC by Zip Code

29681 29654 29651 29356 29607 29661 29687 29635 29615 29613 29650 29602 29605 29604 29609 29603 29680 29606 29617 29608 29673 29610 29612 29690 29614 29644 29616 29627 29636 29669 29652 29601 29688 29662 29683

Active Properties
Address Beds Baths Living ft2 List Price Cost per ft2 DOM
Altamont Road N/A 0 N/A $6,000,000 Unknown 869 days
27 Boggs Street 2 3.5 5,400 $4,100,000 $759 58 days
114 Dominick Court 6 9.5 7,000 $3,775,000 $539 14 days
355 S Main Street Unit Residence 1204 3 3.5 2,600 $3,200,000 $1,230 28 days
207 Welling Circle 4 5 5,200 $2,950,607 $567 15 days
355 S Main Street Unit Ste 1002 3 3 2,600 $2,900,000 $1,115 147 days
20 Babbs Hollow Road 5 7 7,000 $2,900,000 $414 273 days
207 Abbot Trail 4 5 5,400 $2,750,605 $509 16 days
1 Pete Hollis Boulevard N/A 0 N/A $2,500,000 Unknown 452 days
2402 E North Street N/A 0 N/A $2,500,000 Unknown 1491 days
Average: 3.4 2.2 2,081 $489,286 $249 123 days
Viewing 1 - 10 of 992
Properties Under Contract
Address Beds Baths Living ft2 List Price Cost per ft2 DOM
9 Frady Road N/A 0 N/A $3,469,050 Unknown 684 days
355 S Main Street Unit Residence 1001 3 2.5 2,600 $3,200,000 $1,230 2 days
Birnie Street N/A 0 N/A $2,525,000 Unknown 168 days
00 Greenedge Lane Unit Lot 9 4 4.5 4,000 $2,250,000 $562 398 days
34 Southland Avenue 4 4.5 4,200 $1,899,000 $452 120 days
301 E Broad Street Unit Unit 501 2 2 2,200 $1,470,000 $668 236 days
No address 4 4 3,000 $1,425,000 $475 148 days
383 Augusta Street 3 3.5 2,600 $1,350,000 $519 186 days
369 Augusta Street Unit Lot 3 3 3.5 2,600 $1,270,000 $488 15 days
327 Augusta Street Unit Lot 2 3 3.5 2,600 $1,270,000 $488 106 days
Average: 3.2 2.5 1,985 $493,330 $255 82 days
Viewing 1 - 10 of 291
Sold Properties
Address Beds Baths Living ft2 List Price Sold Price Cost per ft2 DOM Sold Date
2 Southland Avenue 5 5.5 5,000 $2,899,000 $2,700,000 $540 54 days 11/28/22
38 Southland Avenue 4 4.5 4,200 $2,399,000 $2,100,000 $500 63 days 10/14/22
6 Southland Avenue 5 5.5 4,200 $2,250,000 $2,050,000 $488 90 days 1/25/23
504 Hidden Hills Drive 5 4 6,400 $2,499,605 $2,000,000 $312 11 days 12/8/22
111 Rockingham Road 5 8 6,600 $2,150,000 $2,000,000 $303 43 days 10/7/22
36 Southland Avenue 4 4.5 4,200 $1,999,000 $1,999,000 $475 70 days 10/28/22
11 Monet Drive 5 4.5 6,200 $1,995,000 $1,900,000 $306 39 days 1/30/23
2049 Cleveland Street Extension 6 6.5 7,000 $1,850,000 $1,845,000 $263 4 days 12/9/22
106 Oakview Drive 5 3.5 4,000 $1,950,000 $1,750,000 $437 23 days 1/13/23
327 Augusta Street Unit Lot 1 3 3.5 2,800 $1,380,000 $1,603,467 $572 369 days 3/21/23
Average: 3.2 2.2 1,864 $385,405 $377,221 $212 47 days
Viewing 1 - 10 of 1540

“ Based on information submitted to the MLS GRID as of . All data is obtained from various sources and may not have been verified by broker or MLS GRID. Supplied Open House Information is subject to change without notice. All information should be independently reviewed and verified for accuracy. Some IDX listings have been excluded from this website. Properties may or may not be listed by the office/agent presenting the information © 2023 Canopy MLS as distributed by MLS GRID”

Last Updated: